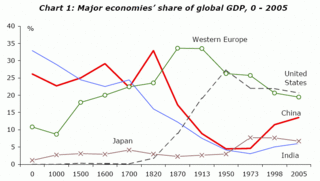
Historical Shares of World GDP
I was reading this article in the NY Times interviewing Nandan M. Nilekani, the chief executive of Infosys Technologies and he made the comment:
If you go back to the 1830's, India and China were 50 percent of the world's G.D.P., and then they missed the entire revolution of industry. So if you take a long view of this game, it's just part of the process.Which reminded me of this really cool graph I saw once that compared the GDPs of India, China, US and Europe over hundreds of years. I found it on a Google search, but for the life of me I can't find it again.
 But I found something similar in this .pdf. This graph (click on it for a larger version), shows the big 4 economies (plus Japan) from 0-2005.
 Interesting points:
1) In 1700 India, China and Europe had about the same GDPs at 20% of world GDP each.
2) From 1700 to 1950, India and China (well, early 1800s for China) are straight down hill while the US is straight up
3) Around 1973 India and China awoke and are starting to climb back, while US and Europe fell respectively.


No comments:
Post a Comment
Note: Only a member of this blog may post a comment.